Hi,
I have just started looking into PyDPF. I am bit struggling with some of the aspects of it. I want to make plot & html file for a result (temperature) with scoping to a named selection.
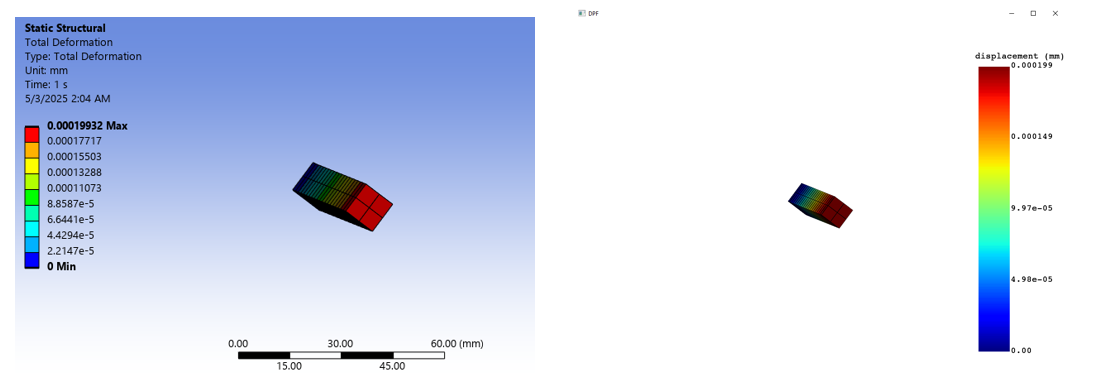
1) I am using .plot function to make images. I am using Graphics.Camera inputs from Mechanical. How does translation from "FocalPoint", "ViewVector" & "UpVector" to cpos work? I used same numbers I obtained from mechanical to make view using cpos, but the images are completely different.
2) I am using mesh_to_pyvista function to convert mesh to vista mesh & use export_html function to get html plot
Here is how code looks like:
from ansys.dpf import core as dpf
result_file="path to rth file"
model = dpf.Model(result_file)
named_selection_name=meshedRegion.available_named_selections[0] #1st NS selsected
timeSteps = model.metadata.time_freq_support.time_frequencies.data[0] #1st time stamp
mesh_scoping = model.metadata.meshed_region.named_selection(named_selection_name) # from get_result fnuction get solutionField & mesh_scoping ("scoping" in function)
Extract Temperature Field
temp = model.results.temperature(mesh_scoping=mesh_scoping)
temp.inputs.time_scoping.connect(timeStep)
solutionField = temp.eval()[0]
mesh_op = dpf.operators.mesh.from_scoping(scoping=mesh_scoping, mesh=model.metadata.meshed_region)
named_selection_mesh = mesh_op.outputs.mesh()
solutionField.plot(meshed_region=named_selection_mesh, screenshot=workingdir+'/'+"output_image.png", cpos="iso") #cpos=cpos
''' I want understand how cpos work
cpos = [
(-0.005702506,0.002437758,0.00166524), # Camera position (X, Y, Z) position
(0, 1, 0), # Target point (X, Y, Z) Focal point this point +Y axis towards viewer
(0,0,-1), # Upward direction (+y) View up
]
'''
nodes = model.metadata.meshed_region.nodes
op = dpf.operators.mesh.mesh_to_pyvista(
coordinates=nodes.coordinates_field,
as_linear= bool(),
mesh=mesh_op, #scopped mesh
vtk_updated=bool(),
as_poly=bool(),
)
result_nodes = op.outputs.nodes().data
result_cells = op.outputs.cells()
result_cell_types = op.outputs.cell_types()
import pyvista as pv
grid = pv.UnstructuredGrid(result_cells, result_cell_types, result_nodes)
Step 4: Assign synthetic temperature data
temperatures = solutionField.data # Example nodal temperatures
grid.point_data["Temperature"] = temperatures
Step 5: Visualize and export to HTML
plotter = pv.Plotter()
plotter.add_mesh(grid, scalars="Temperature", cmap="jet", show_edges=True)
plotter.add_scalar_bar(title="Temperature (K)")
plotter.view_isometric()
plotter.window_size = [1920, 1080]
plotter.export_html("tetra_temperature.html")