I am trying to create an ACT result which makes a contour plot only on elements which meet a certain criteria. I would like this to work for multi step analyses, so that as each step is evaluated the criteria is calculated and the display is updated to only plot the elements which meet the criteria.
So far I have tried setting the values only on the elements which meet the criteria.
def evalVMStress(result, stepInfo, collector):
    # open result file to read results
    with result.Analysis.GetResultsData() as reader:
        reader.CurrentResultSet = stepInfo.Set
        results = reader.GetResult('S')
        results.SelectComponents(["X","Y","Z","XY","XZ","YZ"])

        # get conversion factor for result units to SI units
        unit = results.GetComponentInfo("X").Unit
        unitfactor = units.ConvertUnit(1.0, unit, "Pa")

        # get stress criteria
        sCriteria = result.Properties['stslowerlim'].Value * unitfactor

        # calcualte von mises stress
        values = [] # list containing all element nodadal values
        newIds = [] # list containing element ids to scope display to
        for elemId in collector.Ids:
            elemVal = results.GetElementValues(elemId)
            # separate out arrays of component values
            # elemVal = [SX1, SY1, SZ1, ..., SX2, SY2, ...]
            xVals = elemVal[0::6]
            yVals = elemVal[1::6]
            zVals = elemVal[2::6]
            xyVals = elemVal[3::6]
            xzVals = elemVal[4::6]
            yzVals = elemVal[5::6]

            # create list of eqv values
            eqvVals = []
            for i, sx in enumerate(xVals):
                eqv = (1/sqrt(2))*sqrt((xVals[i]-yVals[i])**2 + (yVals[i]-zVals[i])**2 + (zVals[i]-xVals[i])**2 + 6*(xyVals[i]**2 + yzVals[i]**2 + xzVals[i]**2))
                eqvVals.append(unitfactor*eqv)

            # check if any nodal value is above the criteria
            if any(s > sCriteria for s in eqvVals):
                # set value
                collector.SetValues(elemId,eqvVals)
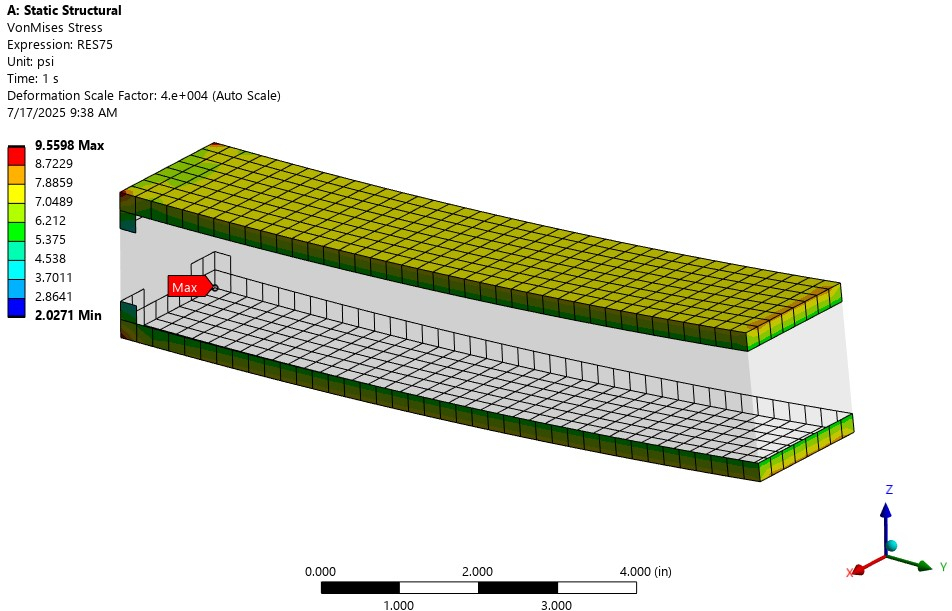
This is close to what I am looking for, but the contour plot only shows results on the surface of the elements.
I have also tried using collector.SetAllIds() to change the collector to only elements that meet the criteria, but that didn't work either.
Anybody have suggestions on how to accomplish this?