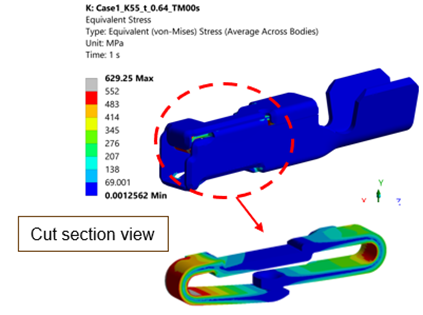
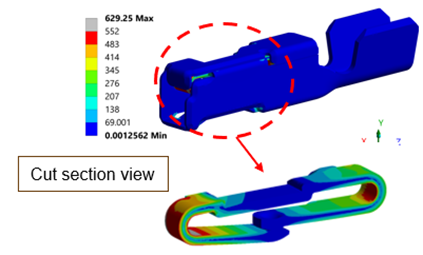
I am working on report automation and able to extract the figure currently working on extracting high stress and strain
You can use this sample script for the above case but this won't capture the section view-
import math

import units

stat = Model.Analyses[0]

soln = stat.Solution

tolerance=1000

equiv_stress = soln.AddEquivalentStress()

soln.EvaluateAllResults()

plot_data = equiv_stress.PlotData

mesh_node_ids = [node.Id for node in stat.MeshData.Nodes]

stress = {}

for i, node_id in enumerate(plot_data['Node']):

    if node_id in mesh_node_ids:

        stress[node_id] = plot_data['Values'][i]

max_value = equiv_stress.Maximum.Value

max_nodes = []

for node_id,value in stress.items():

    try:

        if abs(round(value, 2) - round(max_value, 2))<tolerance:

            max_nodes.append(node_id)

    except:

        continue

for node_id in max_nodes:

    node_obj = stat.MeshData.Nodes[node_id]

    x = node_obj.X

    y = node_obj.Y

    z = node_obj.Z

cam = Graphics.Camera

zoom_level = Quantity(75, "mm")

cam.SceneHeight = zoom_level

cam.SceneWidth=zoom_level

offset = 500

target_p = Point((x, y, z), "mm")

eye_p = Vector3D(x + offset, y + offset, z + offset)

up_v = Vector3D(0, 1, 0)

cam.FocalPoint=target_p

cam.ViewVector=eye_p

cam.UpVector=up_v

Graphics.Redraw()

soln.AddImage()
@Mahesh_G said: I am working on report automation and able to extract the figure currently working on extracting high stress and strain !