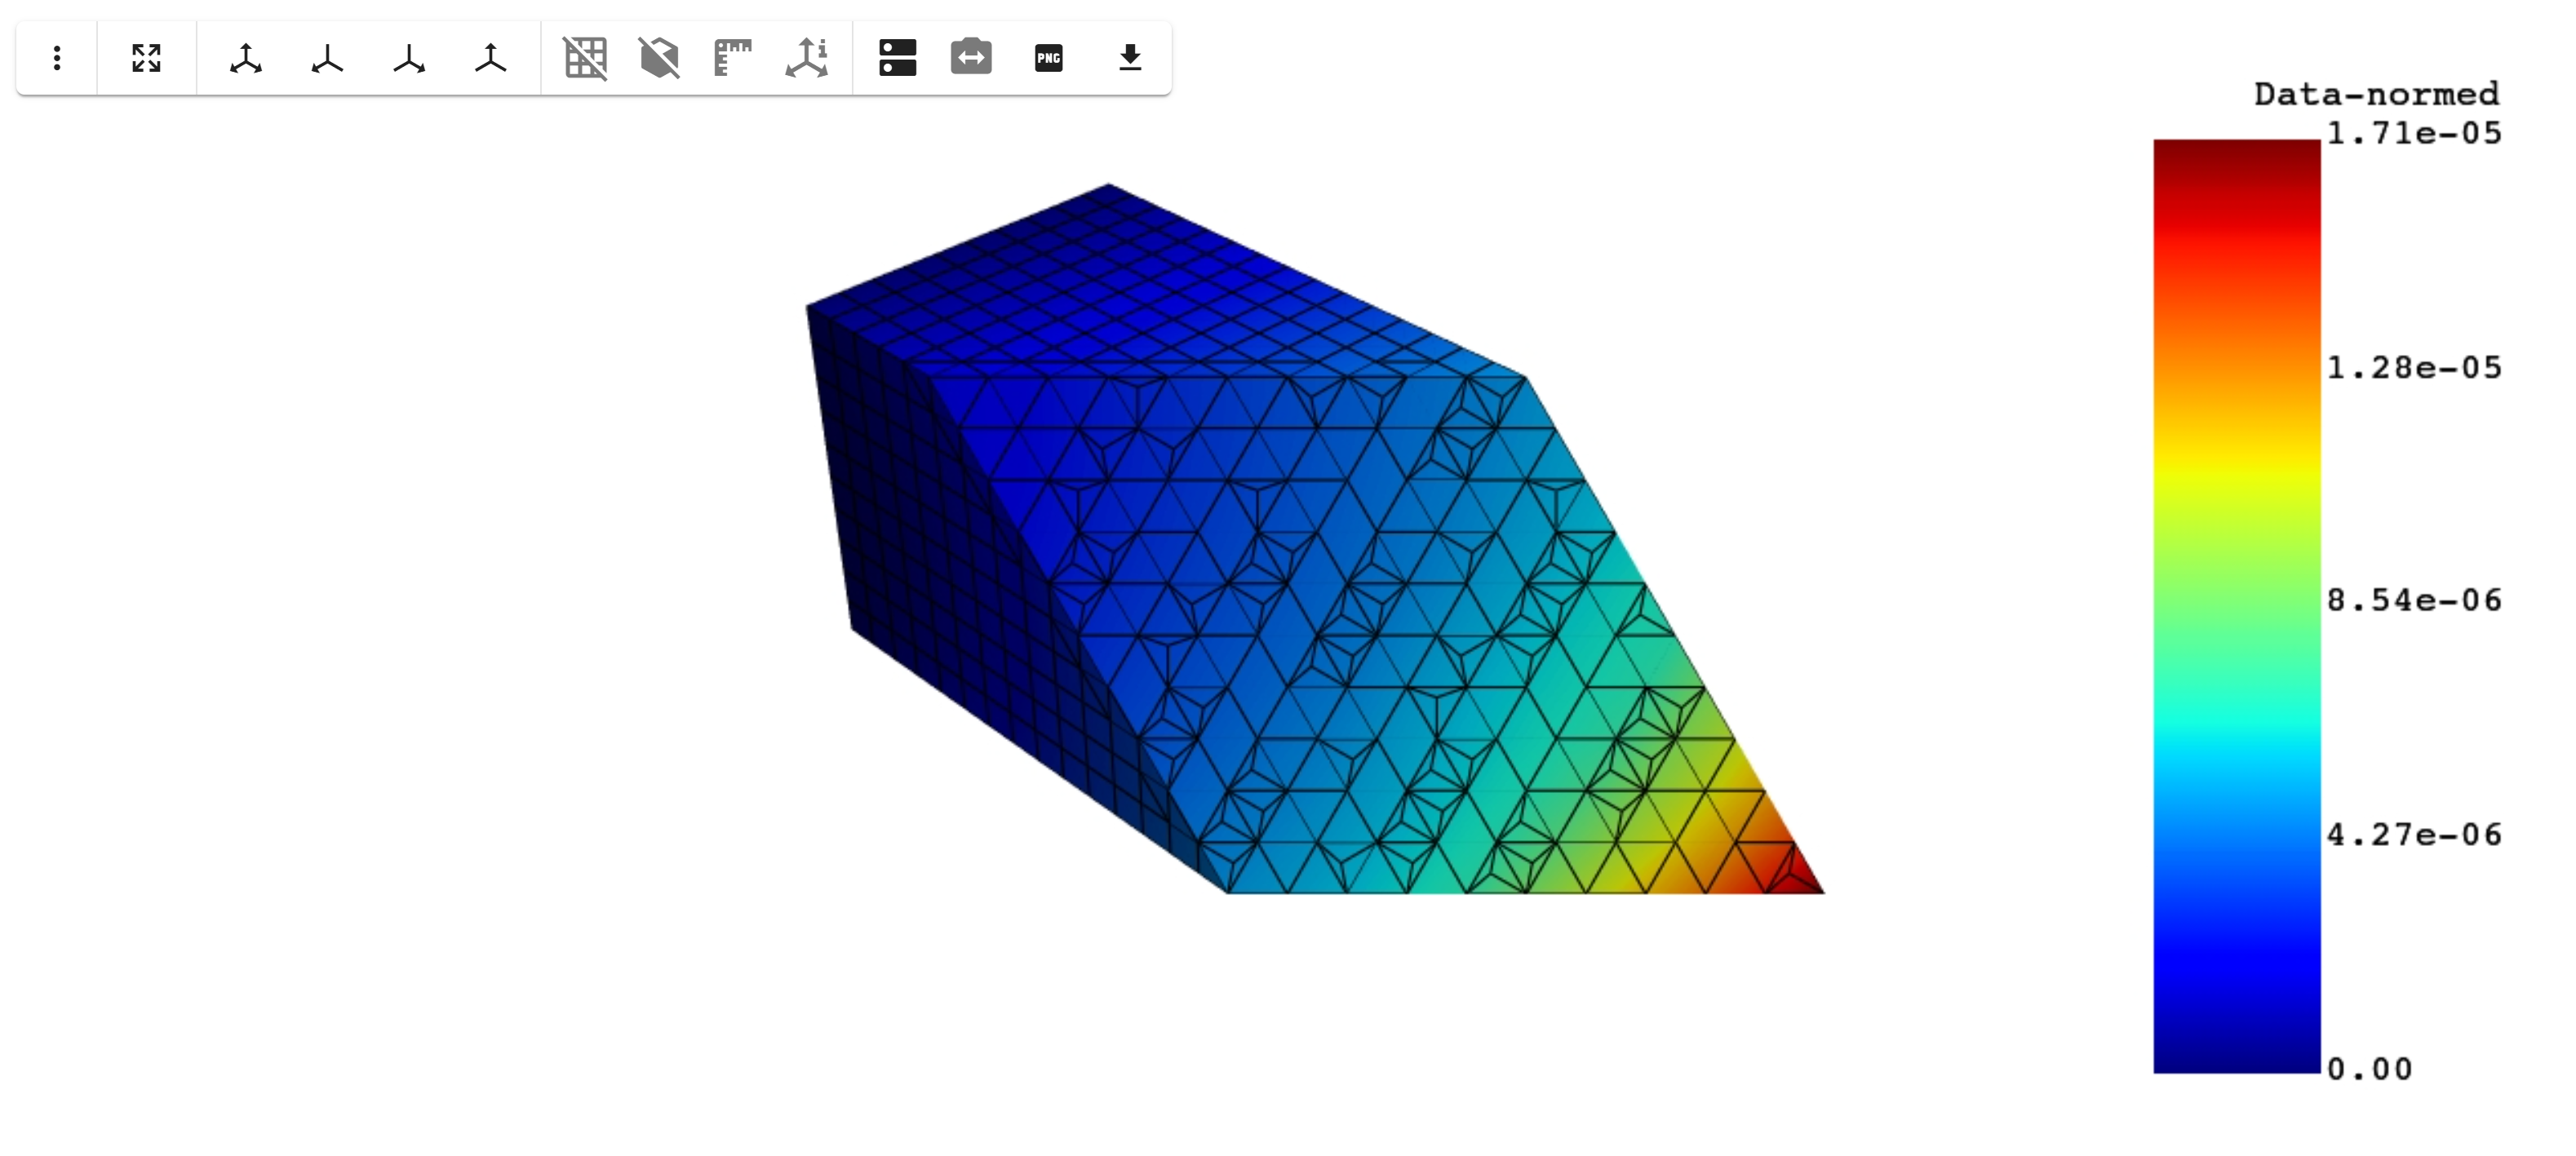
How to plot results on a Mesh cross-section?
from ansys.dpf import core as dpf

from ansys.dpf.core import examples

import pyvista

dpf.start_local_server(ansys_path="C:/Program Files/ANSYS Inc/v242")


model = dpf.Model(examples.find_simple_bar())


results = model.results

displacements = results.displacement()

fields = displacements.outputs.fields_container()


mesh = model.metadata.meshed_region

mesh.plot(fields,off_screen=True)


normal = (1, 1, 1)

plane = pyvista.Plane(i_size=30, j_size=30, direction=normal)

pv_mesh = mesh.grid

clipped = pv_mesh.clip(normal=normal)

p = pyvista.Plotter()


p.add_mesh(clipped, show_edges=True)

p.show()