I have a modal analysis and would like to generate the total deformation result for all mode shapes and add a figure below each. How could I do this?
Here is an example of how to generate the total deformation result for all mode shapes and add a figure below each with Mechanical Scripting.
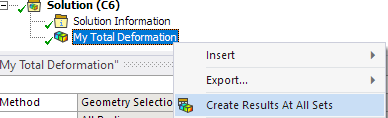
Firstly, I created a Total Deformation object of interest named "My Total Deformation" in a Modal analysis.
my_result = ExtAPI.DataModel.GetObjectsByName('My Total Deformation')[0]
allModeShapeResults = my_result.CreateResultsAtAllSets()
The .CreateResultsAtAllSets() function is equivalent to right-clicking on the result object and selecting "Create Results at all Sets".
.CreateResultsAtAllSets()
Simultaneously, a list of the created result objects is saved in allModeShapeResults which is convenient for the later iteration.
allModeShapeResults
Finally, let's iterate over all the mode shapes in the list and create a figure for each.
for modeShape in allModeShapeResults:


	modeShape.Activate()

	modeShape.RetrieveResult()
	modeShape.AddFigure()