Hello,
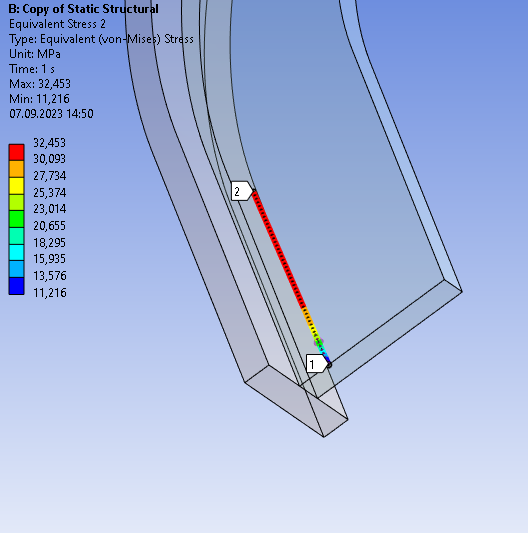
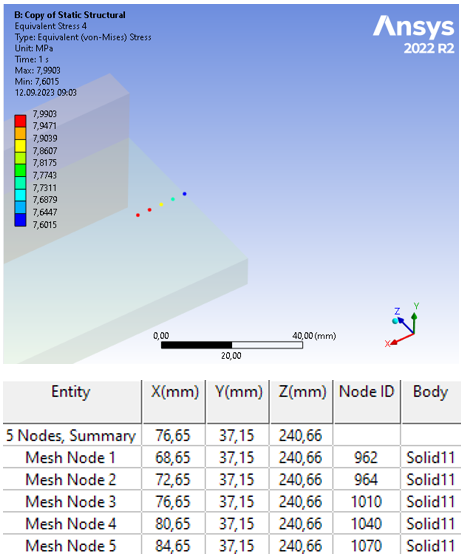
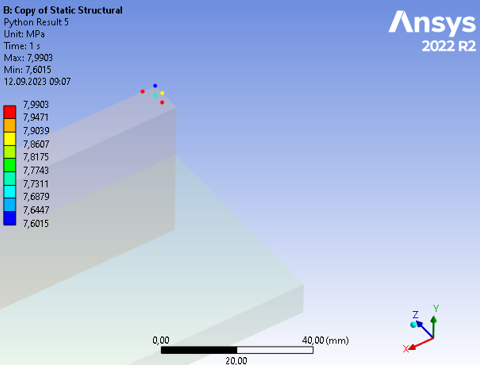
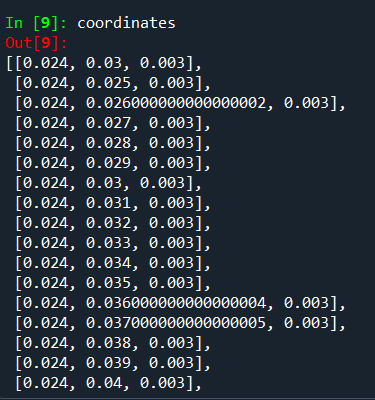
Is it possible to plot the stress values of my model at certain coordinates (theoretical weld transition) in Mechanical? The coordinates result from the joint lines of two plates and a defined evaluation distance to the joint lines. Thus, they usually do not lie exactly on a node, but can also lie in the middle of an element. So some kind of mapping is probably necessary.
The result should look similar to a path stress result, which graphically displays values relatively independent of the underlying meshing.
The coordinates and stress components at the evaluation points have already been calculated. The question now is how I can manage a graphical output.